Making Accurate Predictions a Tool for Management
Why it’s useful to make predictions
As more and more projects become agile, reporting has to support agile work environment. I use predictions in project reporting. Before each project phase I make a progress prediction and compare it to a real time progress percentage.
Why I do this:
- I get a report that is easily interpreted
- Project is more freely executable
- I include unplanned activities to the report to get a more realistic status overview
- I get an objective for every week –> Tool for management and incentive programs
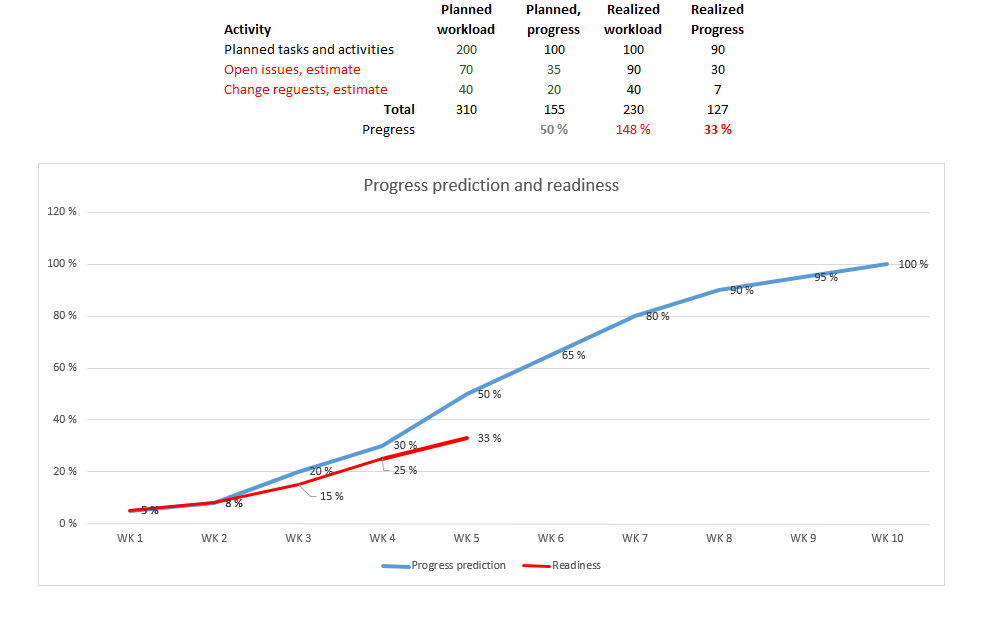
Include Unplanned Activities in the Progress Percentage
Usually the progress percentage is calculated from activity progress. All change requests are reported separately.
I include all unplanned activities like open issues in my calculations as well.
Why I do this: Going through every issue takes time. I use an estimate of 2.5hrs per issue –> If there are 50 open issues in a project, work hours come up to around 125hrs.
When making a prediction I always estimate the work load for open issues. I make sure that the project has the capacity to solve problems.
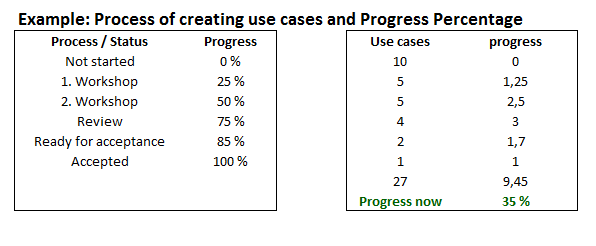
Making the Prediction
How to calculate the prediction graph:
- Plan the upcoming project phase.
- Plan processes: e.g. How to write and accept the use case. Define progress percentage for every process phase.
- Plan who does what and when.
- Make an estimate of open issues and the time to process them.
- Draw a graph of the progress - ergo the prediction
- Communicate, accept plan = commit
- Compare real time progress to your prediction
The Prediction Steers You to Work According to Plan
A lot of people have asked how I can make such accurate predictions. I always say I really can’t. Well communicated prediction steers people to work according to plan. If you announce that we are 5% late from our goal that week, people start to think what tasks could be done to make that goal.
Another clear benefit is that making predictions requires careful planning. Before you publish and communicate your graphs, you actually have to have your plan well thought out and monitoring set to place.
On the other hand, you could just say well planned is already half done. And if it is half done, why bother so much with the rest.
Download eBook Business Critical Project Running?
Download a guide on software testing in development projects. You’ll avoid many common mistakes and succeed in the implementation.
Did you know?
Quality Gate is a user friendly tool for software development and testing projects
Improved testing efficiency, 70% less emails and real time reporting
Read more
Roadmap is a user friendly software for development projects
Easily plan and execute even the most challenging development project
Read more
- How to avoid negative attitude? 20.02.2017
- Don’t Be Guilty, it’s Expensive 26.01.2017
- Can People be Motivated? 15.01.2017
2016 © Project-TOP Solutions Oy. Privacy policy | Terms of Service